Food Web Data
Simulation 1
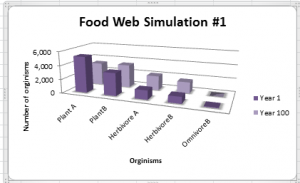
The goal is to have all the orginisims survive in there enviorment for 100 full years. Our simmulation contained 2 hebivores and 2 plants.First we chose our orginisims to place in the inviorment and we dicided witch herbivores ate what plant.Next we started it up and we not sucsessful so we chose differint orginisims.Then we sucsessfuly made a stable enviormentand all the orginisims lived 100 years and we recorded are data.Finally we created our ggraphs on microsoft exel.We noticed three things about our orginisims based on the data. They were that plant b started with 3297 and ended wiith 3391 and omnivore b did not do  very well and plant a had less the second time than the first.
Simulation 2
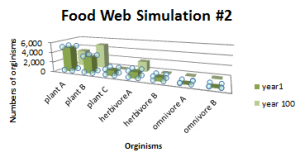
The goal was to have all the orginisims survive 100 full years in its enviorment. First we Chose three differint plants ,two herbivoresand two omnivoresand it started up. we observed that alot did not survive so we changed it up and we were not lucky but we got stuck with that.Then We recorded our data and even thought a couple did not survive. Finally We created our graph on microsoft exel. We noticed three things about our orginnisims based on our data. They were
1.That plant A started 5,008 and ended 3,333.
2.Plant B had more the second time!
3. Omnivore B had 57 as its total.
